FAQ
General
Contact our office by email (support@ebetsystems.com.au) or by phone (1300 060 026) and we'll organise a demonstration to show you through the main features of the Astute BI website.
Yes, training and review sessions are conducted to ensure all relevant staff members within your venue are confident in the interpretation and analysis of Astute BI reports. This training is part of the on-boarding process and provided at no additional charge.
Existing Astute BI Licensees
If your Venue already has a licensing agreement with Astute BI and
you would like to be given access to the online reporting suite, call 1300 060 026
or send an email to support@ebetsystems.com.au and
request access.
We will then contact the authorised password holder at your Venue to confirm their agreement to your being given access. Once confirmation has been received, we'll send the login information to your email address.
New Astute BI Licensees
When you sign up with Astute BI for our smart reporting suite, you
are provided with a username and password that is unique to your venue.
If you have not yet received the information or it has been misplaced, call 1300 060 026
or send an email to
support@ebetsystems.com.au
and if you are listed on the account, we will email the information to you.
Want to become a Astute BI Licensee?
You can request a live demonstration of the Astute BI system to see
if its right for your venue:
Request a Demonstration
If you have any questions about our service: Click here to contact us
There are a number of benefits in participating in the benchmarking offered via Astute BI:
To ensure your venue's profitability & efficiency
Benchmarking allows you to compare your venue’s performance against the greater licenced
club industry and provides factual information on which to base your business
decisions. Benchmarking takes the ‘gut-feel’ out of decision-making. By benchmarking
with Astute BI, you can compare your venue’s performance overall and drill down
to the key areas that affect your business (e.g. bar, gaming, food, marketing,
fixed costs and more).
If the performance of your venue is affected positively or negatively by regulatory changes or consumer spending habits, you can see whether other venues are feeling similar effects.
To comply with Corporate Governance responsibilities.
Benchmarking assists board members to fulfill their roles and responsibilities
to the venue and its members.
To ensure the future of the industry
Benchmarking assists the Gaming Industry to support its case to all stakeholder
groups (e.g. government, community). By gathering detailed performance and operational
data on an industry wide basis, the Industry can undertake detailed economic
modeling to assess the likely impacts of any proposed regulatory changes.
The Astute BI system is available 24 hours a day via the web browser in any computer, tablet, smart phone or internet device.
To access the system:
- Go to the Astute BI website on your device - https://www.astutebi.com.au
- Click on the Login button located in the top right corner of the screen.
- Enter the username and password that you were given when you received an email from Astute BI confirming your data had been imported into the system.
- Click login to access your reports.
NOTE: If you have not received your login information please contact your Astute BI representative who will provide you with the details. If you need any changes to be made to your login details please contact Astute BI on 1300 060 026 or lodge a support ticket through this help area.
There are 4 systems that we can automate gaming data transfer for your venue direct into the Astute BI data warehouse:
- Maxgaming
- eBET
- OSS
- Odyssey
Do you use one of these systems? If yes, then with your permission, we can set up an arrangement to automatically capture your gaming data. Call 1300 060 026 or email support@ebetsystems.com.au and we can get you set up.
Advantages of Automating Gaming Data Transfer
There are a number of advantages in automating the transfer of your gaming data
into the Astute BI system:
- Daily reporting available
- Monthly reports are made available as soon as possible after the month ends
- No need to worry about missing the cut-off publish dates
- Streamlines the reporting process
- Able to add additional membership & loyalty information as part of the data transfer
Security
Yes. The Astute BI data warehouse is comprehensively protected with the latest technology in Dynamic Authentication Filter software, data encryption and is hosted with Australia’s leading web hosting service, Web Central.
Your data cannot be viewed by other venues or organisations. Only Astute BI staff and approved password holders at your venue can see your venue’s data.
Data security is very important to Astute BI.
Development of the Astute BI data warehouse and reporting tools has been outsourced to highly skilled, certified Microsoft database developers and administrators.
Every effort has been undertaken to ensure the environment is as secure as possible.
Astute BI also implements a thorough data backup routine to ensure minimal data loss in the event of a server failure or larger scale event.
In the unlikely event that data access is breached, venues will either be notified by e-mail or phone. This would occur within 48 hours of Astute BI becoming aware of any such breach.
The data is segmented in the system so that each venue only has access to their own venue's data. Astute BI data administrators and support staff have access to the full data warehouse.
Within your venue, the designated account holder decides who has access to your online reports. To add or remove access, please phone 1300 060 026 or email support@ebetsystems.com.au.
Data is stored in our secure, outsourced web hosting environment with Melbourne IT. Astute BI has utilised a Microsoft based platform and has a thorough backup and server patching routine. Melbourne IT is responsible for physical security and network security to the servers.
Data is secured by using industry standard SSL (secure socket layer). Further information can be found at SSL Explained.
Data is either transferred to our secure storage service, Sharefile, or directly via FTP over SSL (secure FTP) to our server. Both options ensure data is encrypted by SSL when transferred to Astute BI.
Reporting
Yes, you can. We have different reports available depending on what modules your venue is subscribed to.
Want to receive this report in your inbox each month?
If you are a licensee of our Gaming Module and didn't receive this report please
email us and
we'll get a copy out to you.
Monthly Data
If you are submitting your data manually then it is available at different times
as financial and gaming data are published separately. Financial data is
published in batches each week and gaming data is published once per month.
Financial data is published by mid-month the following month, for example, July data will be first published by mid August and then rolling publishes will occur each week after, usually for four weeks. It is preferable that you submit your financial data as soon as possible at the end of the month so that your reports will be available in the earliest publish cycle.
Gaming data is published by the middle of the month, for example, July data is published by mid August. It is important that you submit this information as soon as possible by the end of the month so that you don't miss the publish cycle.
Please note that submission rules apply for monthly benchmarking results.
Daily Data
Our automated processes enable us to have daily gaming, carded gaming & POS
data available on the Astute BI website the following day.
There are 3 ways to find data on the best performing games.
Option 1
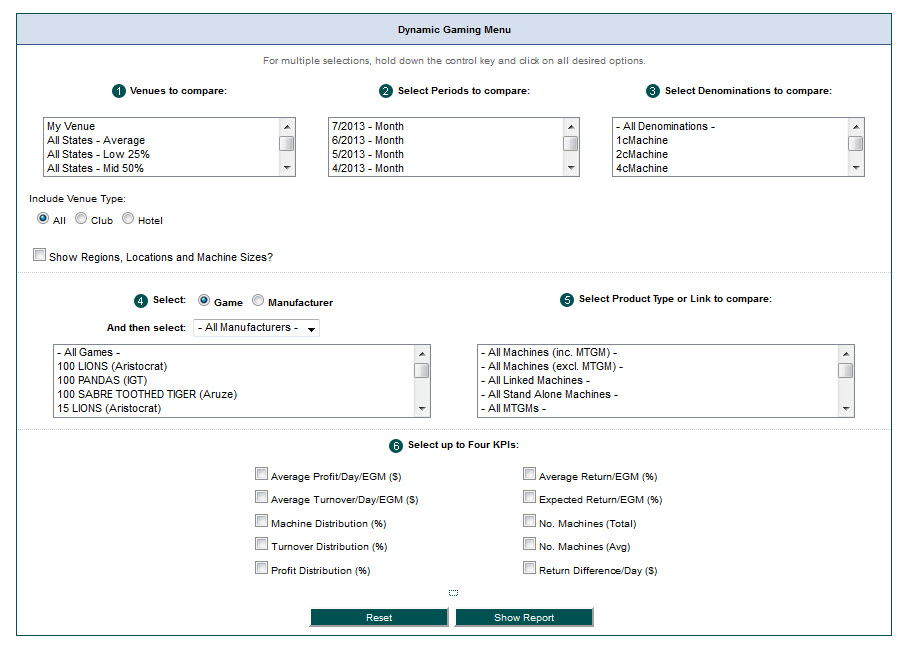
The first way to find the best performing games is by going to Benchmarking -> Gaming -> Report Builder.
Once the Report Builder screen loads, you can make your selections based on the timeframe and averages you would like to see. You will then need to select all denominations and all games that you would like to see data for and select the type of machines.
TIP: Rather than clicking on ‘All Games’ at the top of the games filter which
will give an amalgamated number for all games, highlight specific games
to see individual data for a game. You don’t need to scroll
through each game to select all individual games. Just select the first
game then press SHIFT + END key together and all games will be highlighted through
to the bottom of the list. Please note that by selecting the individual games
you will be generating a large report which will take more time to generate.

Once the dynamic report has been generated, you can rank each column by clicking on the headings at the top.
Option 2
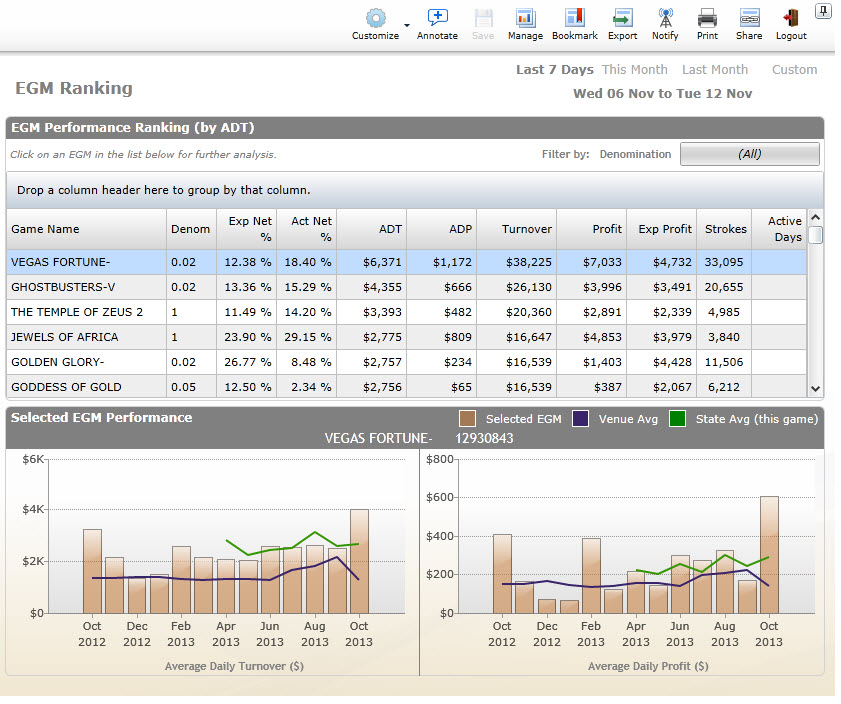
The other way to find the best performing games is from
Astute BI -> Gaming Intelligence -> EGM Ranking
report section which is based on daily data. This report is only available
for licensees that automatically submit daily data.

Option 3
Gaming ranking can also be accessed from our Market Rankings reports. These
are available on request. Please email support@ebetsystems.com.au
to request a copy of the latest market rankings. These reports are static
reports produced each month and can be downloaded to your computer as PDFs.
Astute BI has developed a comprehensive system to deal with the many different accounting systems used by our licensees. With over 600 customers, we process data from over 10 accounting systems and over 15 gaming systems each month.
For financial data the processing is done by mapping the individual venue's Chart of Accounts to the Astute BI generic Chart of Accounts. A similar process is done for gaming data.
This allows Astute BI to map the financial and gaming data points that are common across all venues and to exclude details that aren't relevant.
The mapping process allows data from venues in the Astute BI data warehouse to be collated and compared on an equitable basis each month.
Benchmarking is the process of comparing businesses and performance metrics across an industry to determine best practices within the sector.
The three-tier comparison - top 25%, middle 50% and low 25% - is a benchmarking standard used throughout many industries.
Breaking up the averages for venues into three distinct groupings provides a greater level of detail than simply measuring performance against one overall average for each metric. It also provides an easy reference point that you can use to rank your venue’s performance within the industry.
For example, most venue managers would like to be in the top 25% for profitability. Knowing exactly where your own venue is positioned, whether it is in the top 25%, mid 50% or low 25%, puts your venue’s performance in context, provides a guide to what is possible and, through analysis of a range of other metrics, highlights areas for improvement.
Top, mid and low calculations in financial reports are all based on EBITDARD (%) as this is considered the best way to determine whether a venue is performing well. This means that a venue may be performing poorly in the selected KPI (e.g. Food Revenue ($)) but still be listed as being in the top 25%.
The top, mid and low figures in the gaming benchmarking reports are all based on Avg Profit/Day/EGM ($).
The Astute BI system has been developed to enable effective comparison of ‘core licensed venue’ activities. These activities are focused on the operation of food, beverage and gaming activities and their associated operational overheads.
In order to compare different types of venue operations, such as leagues, RSL, bowling and golf, the income and expenditure associated with ‘non-core licensed’ activities, such as football, bowling greens and golf courses, have been omitted. Other ‘business diversification’ pursuits, such as gyms, accommodation, and rental properties are also omitted.
If we consider that a Venue Certificate of Registration is a license given to champion a community cause such as recreational facilities (e.g. bowling, football, golf, returned services support etc.), then the ‘core licensed venue’ activities are the financial engine that allows for those other activities to take place. Astute BI, through the benchmarking reports, provides a direct comparison of these operational activities.
In order to provide a more accurate measure, venue operational efficiency is best standardised using a slight variation on the traditional company measurement, EBITDA (Earnings Before Interest Taxation Depreciation and Amortisation), by adding rent and donations. Rent encompasses the emerging trend of ‘off balance sheet’ rental of IT and gaming equipment while donations is self-explanatory.
EBITDARD has been created as the venue specific standard measure.
EBITDARD is the acronym for Earnings Before Interest, Taxes, Depreciation, Amortization, Rent and Donations.
EBITDARD is an approximate measure of a company’s operating cash flow based on data from the company’s income statement. It is calculated by looking at earnings before the deduction of interest expenses, taxes, depreciation, amortization, rent and donations. EBITDA is the most common calculation however rent and donations have also been excluded from the Astute BI calculation as these are venue specific expense items.
The EBITDARD earnings measure is of particular interest in cases where companies have large amounts of fixed assets that are subject to heavy depreciation charges (such as a company that has purchased a brand or a company that has recently made a large acquisition). Since the distortion caused by accounting and financing effects on company earnings does not factor into EBITARD, it is a good way of comparing companies within and across industries. Sometimes EBITDARD is also called operational cash flow.
EBITDARD is now the standard measure of licensed venue operational efficiency.
At present, SAP machines are included in the 'Stand Alone Machines' category. We are in the process of developing a specific SAP filter for dynamic reports.
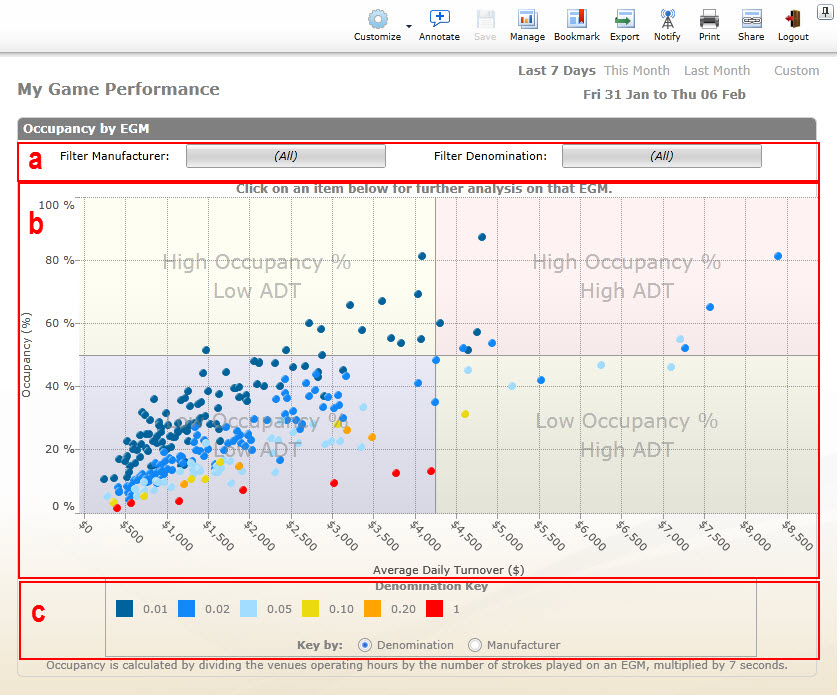
EGM occupancy is measured by the percentage of time that a machine is available (ie. a venue's operating hours) compared to the time that the EGM is played. The higher the percentage, the more popular a game is.

a. Filter Menu
b. Scatter Graph
The Astute BI EGM Occupancy Dashboard (above) displays occupancy and average daily turnover. Click on a dot and a pop up window will appear with details for that particular EGM.
Occupancy is calculated by dividing the venue's operating hours by the number of strokes played on an EGM, multiplied by 7 seconds.
EGMs falling in the red ‘hot section’ have the combination of high occupancy and average daily turnover.